Ecommerce Personalization: The Complete Guide for Founders, Merchants, and Marketers
Your ecommerce personalization journey starts here👇

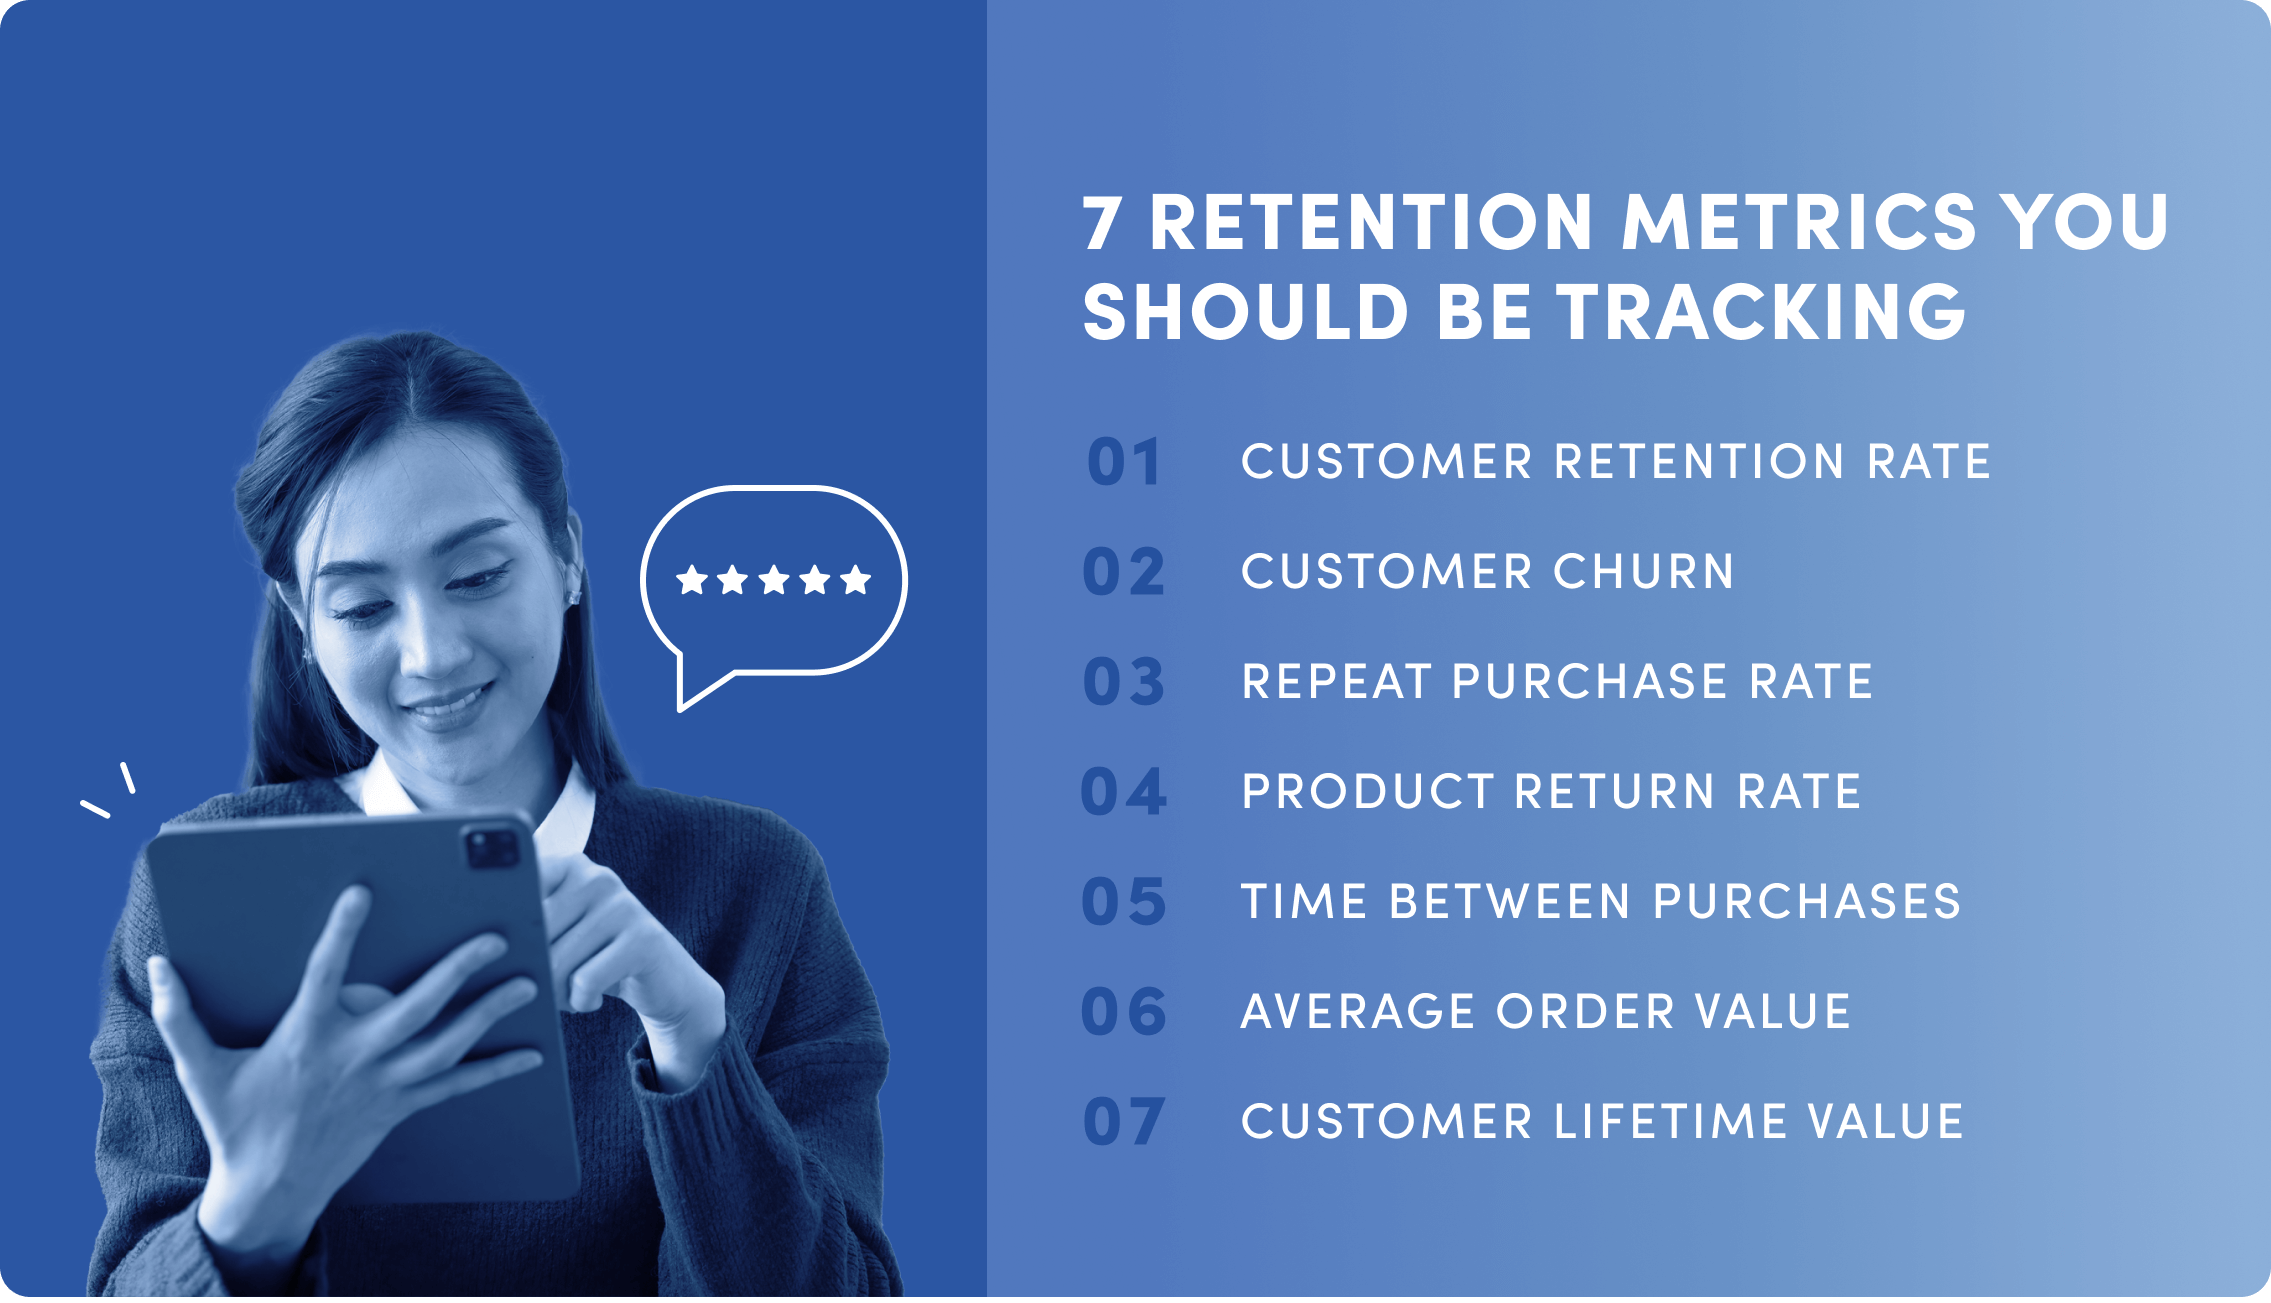
Dive into key retention metrics and explore strategies for tracking and improving customer loyalty.
You know customer retention is good for business. But do you know just how critical it is?

Research done by Fred Reichheld, a loyalty marketing guru and the creator of the Net Promoter Score (NPS), says increasing customer retention by as little as 5% can increase profits by 25% or more. But keeping customers coming back to your ecommerce site takes more than asking pretty please.
Tracking your customer retention metrics helps you pinpoint what your customers love about your products and avoid what causes them to leave your site empty-handed. So as you develop a strategy to improve your customer retention, consider these seven customer retention metrics you should be tracking if you want to improve loyalty among your most valuable visitors.
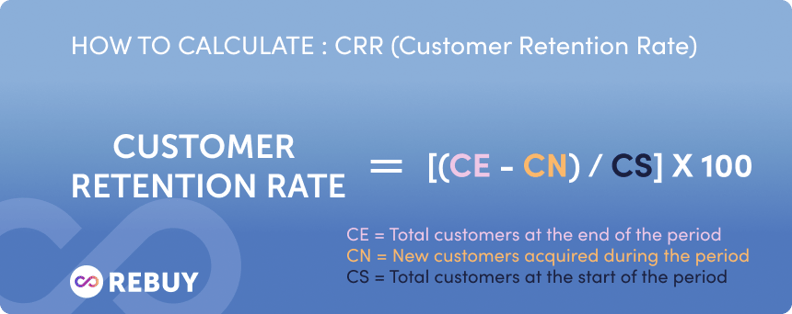
Your customer retention rate is a measure of how well you keep customers coming back to your site over a specific period of time. When you have loyal customers who purchase a second or third time — or who maintain their subscription — you’ll lower your customer acquisition cost (CAC), have monthly recurring revenue you can count on, and grow in a sustainable way.
You calculate your customer retention rate by taking the number of customers at the end of a specific period and subtracting the new customers acquired during that period of time. Divide that number by the number of customers you had at the beginning of the given time period. Multiply by 100 to get your customer retention rate.
The average customer retention rate for ecommerce companies is around 38%.
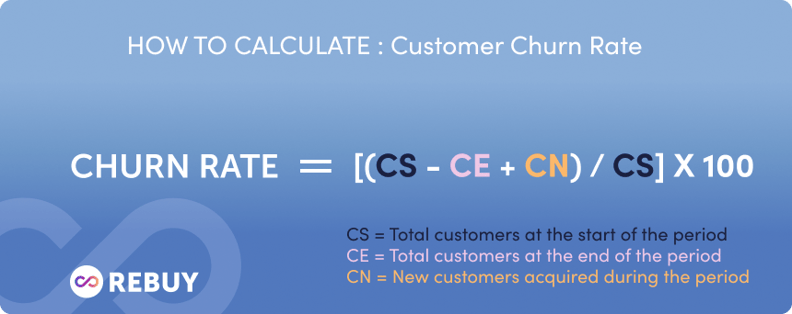
The flip side of your customer retention rate is your customer churn rate.
Customer churn is the percentage of your buyers who stop purchasing from your store or who don’t resubscribe to your products over a certain period. This benchmark shows what percentage of your customers drop out of your purchase funnel, which could be a sign you’re not giving your customers what they want.
Tracking the number of churned customers helps you identify trends that affect your retention efforts, such as seasonality, product selection, and price changes.
Churn comes in two forms: voluntary and involuntary. Voluntary churn is when customers make an active choice not to purchase again or to unsubscribe. Involuntary churn happens when a purchase is uncompletable, such as when a card is declined. To understand how to improve retention, you want to focus on voluntary churn.
For a traditional ecommerce business, churn can be high. One way to combat a high churn rate is through a subscription model. For customers who sign up, a subscription model can decrease your churn rate between 3% and 16% if your average revenue per unit (ARPU) is less than $100.
To calculate your churn rate, subtract the total customers at the end of the time period from the number of customers you had at the beginning and add the number of new customers you acquired. Divide that number by the total number of customers at the start of the period and multiply that by 100 to get the percentage.
For example, if you have 100 existing customers on October 1, 105 customers on October 31, and acquired 10 customers in the month, your churn for October would be 5%.
If you have both a single purchase and a subscription model, be sure to calculate your churn for each separately so you can identify and address issues in each purchase pathway.
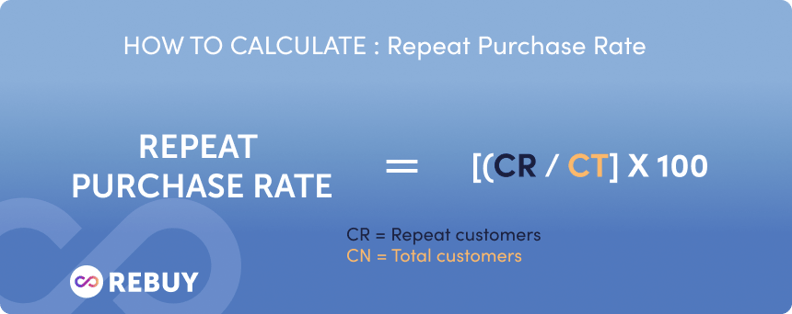
Your repeat purchase rate measures the percentage of customers who make more than one purchase from your ecommerce platform within a specific timeframe.
Though similar to your CRR, you typically measure your repeat purchase rate in months instead of the full year. You will also include new customers in your repeat purchase calculation instead of only current customers who made multiple purchases like you did for CRR.
Measuring your repeat purchase rate helps you learn how loyal your customers are to your products. And you have more data on returning customers, so you can provide them with more tailored recommendations and cross-sells, improving your customer loyalty.
For most ecommerce businesses, you’ll want to see a repurchase rate between 20% and 40%. If your repurchase rate is above 50%, give those loyal customers a high-five.
To calculate your repeat purchase rate, take the number of repeat customers during a given period and divide it by the total number of customers during that same time period. Multiply by 100 to get the percentage. For example, if you had 50 customers in October and 20 of them made more than one purchase during that month, your repeat purchase rate is 40%.
Returns are inevitable for an ecommerce company but aren’t always a bad thing. If a return process is simple, more than 90% of consumers surveyed said they would consider purchasing from that site again.
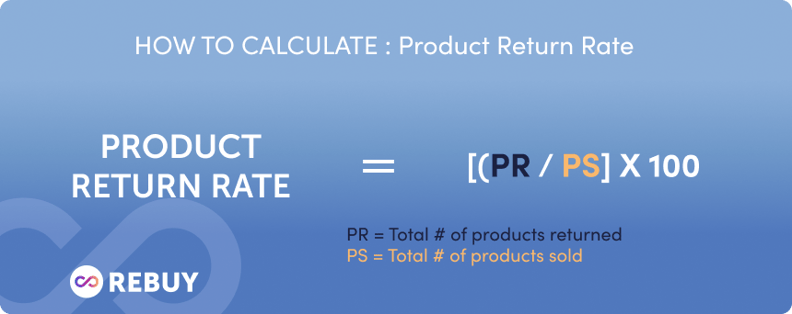
The product return rate is the percentage of all your orders that are returned within a specific timeframe. Understanding your product return rate will help you find ways to set better expectations with customers and improve retention.
According to the National Retail Federation, the ecommerce return rate was 16.5% in 2022, down from 20.8% in 2021.
To calculate your own product return rate, divide the total number of items returned by the total number sold and multiply by 100 to get the percentage. For example, if you sold 100 items in a month and 10 items were returned, your return rate would be 10% for that month.
The time between purchases metric measures the amount of time it takes a single customer to make their next purchase. You can measure the time between the first and second purchase or any subsequent purchase.
Your time between purchases rate helps you create effective retention marketing campaigns. If you know your average TBP is five weeks, you can create automated and targeted email cadences starting four weeks after the initial purchase.
This information also helps you recognize when customers are overdue for a purchase. You can give them a personalized nudge, keeping them in your active customer funnel (and out of your churn rate).
In most ecommerce industries, you can expect an average of about 30 to 60 days between purchases.
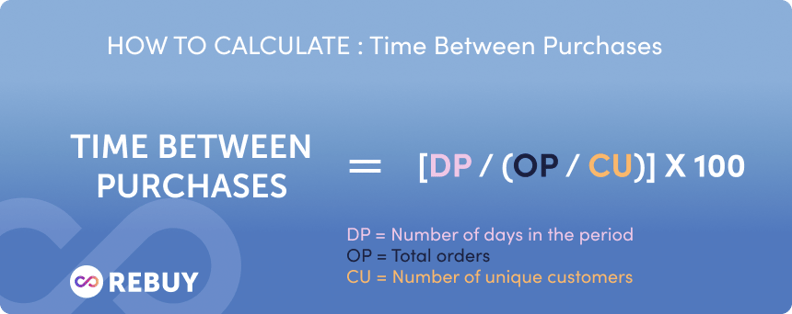
To find your time between purchases, divide the number of orders in a given timeframe by the number of unique customers in that same timeframe. Then, divide the number of days in your time period by that number. If you had 100 orders in a quarter and 40 unique customers, your TBP would be 36 days. TBP = 90/(100/40)
Average Order Value is the average dollar amount spent by customers who make a purchase on your site. When your average order value increases, it means that your customers found more items they liked, giving them more reasons to come back.
In addition to being an important customer retention metric — it’s a key component in measuring customer lifetime value — AOV is a valuable lever for profitability. As you improve your AOV, you also improve total revenue without additional advertising spend.
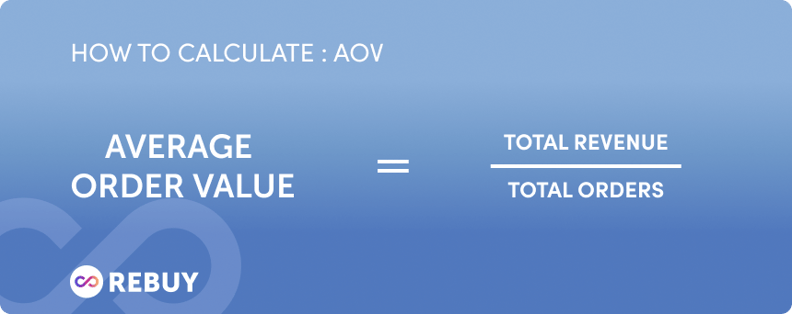
According to a Littledata survey of more than 2,500 ecommerce websites, the AOV for stores with between 20k and 500k monthly visits was $101, with an average range between $54 and $274. To calculate your AOV, take your total sales revenue and divide it by your sales count.
Customer lifetime value measures the net profit of a customer throughout their lifecycle with your site. Your CLV helps you identify the types of buyers who are most likely to spend more over the course of their relationship with you — otherwise known as the customers you want more of.
Some common tools for increasing CLV include loyalty programs, personalized recommendations, subscription programs, and amazing customer service. The byproduct of these initiatives usually also improves overall customer satisfaction, customer experience, and retention.
A good CLV is typically three times your customer acquisition cost. For example, if you have to spend $50 to get a new customer, you want your CLV to be at least $150.
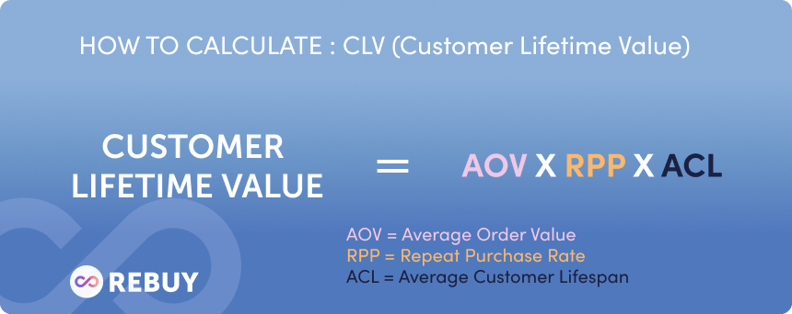
To calculate your customer lifetime value, you’ll need to know your average order value, your repeat purchase rate, and how long a customer typically stays active with you. First, find your customer value by multiplying your AOV by your repeat purchase rate. Then, multiply that number by your average customer lifespan to get your CLV.
It’s helpful to run CLV calculations for different segments of your customer base so you understand which products, types of customers, and acquisition channels drive your highest CLV.
Customer retention metrics will help you understand what keeps your customers coming back and how to dial in your marketing segmentation. But another benefit of knowing your time between purchases, average order value, and other customer retention metrics is more accurate forecasting.
If you know your average customer spends $37 with you every 45 days, you have a better idea of what you need to do in order to meet your KPIs for revenue growth and MRR. And by tracking these metrics regularly, you can clearly see what’s affecting your bottom line and why.
Now that you know which retention levers you want to pull to increase your customer loyalty, you need an ecommerce partner that grows with you. Rebuy helps you accelerate sales with tools like dynamic bundles, upsells, and personalized product recommendations. Learn how Rebuy’s AI-driven intelligent experiences can help you unlock personalization and improve customer retention.
•••
Try Rebuy free and see why the world’s top brands use Rebuy to accelerate sales growth.
Interested in partnering with Rebuy? Let's do it.
To keep up with the latest trends, platform updates, and more, follow us on LinkedIn.
Many benefits of customer retention are obvious (brand loyalty, repeat sales), but there are some non-obvious benefits you should also know about.
Explore the world of customer retention. Learn practical tactics to improve customer retention, re-engage customers, and measure your efforts.
We are excited to announce that Rebuy is now integrated with Malomo.
