Ecommerce Personalization: The Complete Guide for Founders, Merchants, and Marketers
Your ecommerce personalization journey starts here👇
Elevate your ecommerce revenue optimization with analytics. Identify trends, make gradual improvements, and boost profits.
Each click your shoppers make on your Shopify store is another clue to unraveling the big mystery of sales growth 🕵️♀️
Uncover the clues so you can unmask the culprit holding back your ecommerce store. You don’t even need your own Mystery Machine. All you need is revenue analytics.
By digging into your revenue analytics, you will understand how your customers engage with your store and what you can do to improve their experience and drive more revenue.

Revenue analytics is the process of collecting and analyzing data about how much money your ecommerce platform is generating. This data allows you to drill into the details of how well your business is doing and what’s driving success.
Analyzing this performance data is the first step in revenue optimization. You have to know how your customers are interacting with your site before you can adjust pricing and marketing strategies effectively.
The metrics involved in your revenue analysis will vary based on the goals you have for your site. If you focus on upgrading non-paying users to a paid plan, you’ll want to pay attention to different metrics than if your goal is to increase the number of items per order.
But some metrics are useful regardless of your goal.
These revenue metrics show you how your business is doing right now and ways you can improve the long-term health of your ecommerce platform.
Revenue analytics enable you to understand what’s working in your ecommerce store so you can scale the good parts and fix the bad.
They help you understand your revenue growth and optimize your revenue management. By looking at your metrics, you see how people are buying from you and are able to identify trends.
Perhaps you find that your most loyal customers all have a specific product in common. Maybe customers who start using their subscription within the first week are more likely to renew. Using this information, you can identify opportunities for new revenue, such as bundles centered around that specific product or special offers that entice users to start their subscription immediately.
Reviewing your revenue analytics on a regular basis will also give you a better understanding of your customers’ behavior, including any unusual seasonality of products. You might find a specific product you sell is popular around Father’s Day or that your service has a market around back-to-school. This information will help you plan new marketing campaigns and offer targeted discounts.
With these new insights, you can create more accurate forecasting. Knowing your churn benchmarks and causes, for example, will help you better plan for events you know make people unsubscribe, such as price increases. With better forecasting, you will make more strategic decisions for the growth of your business.
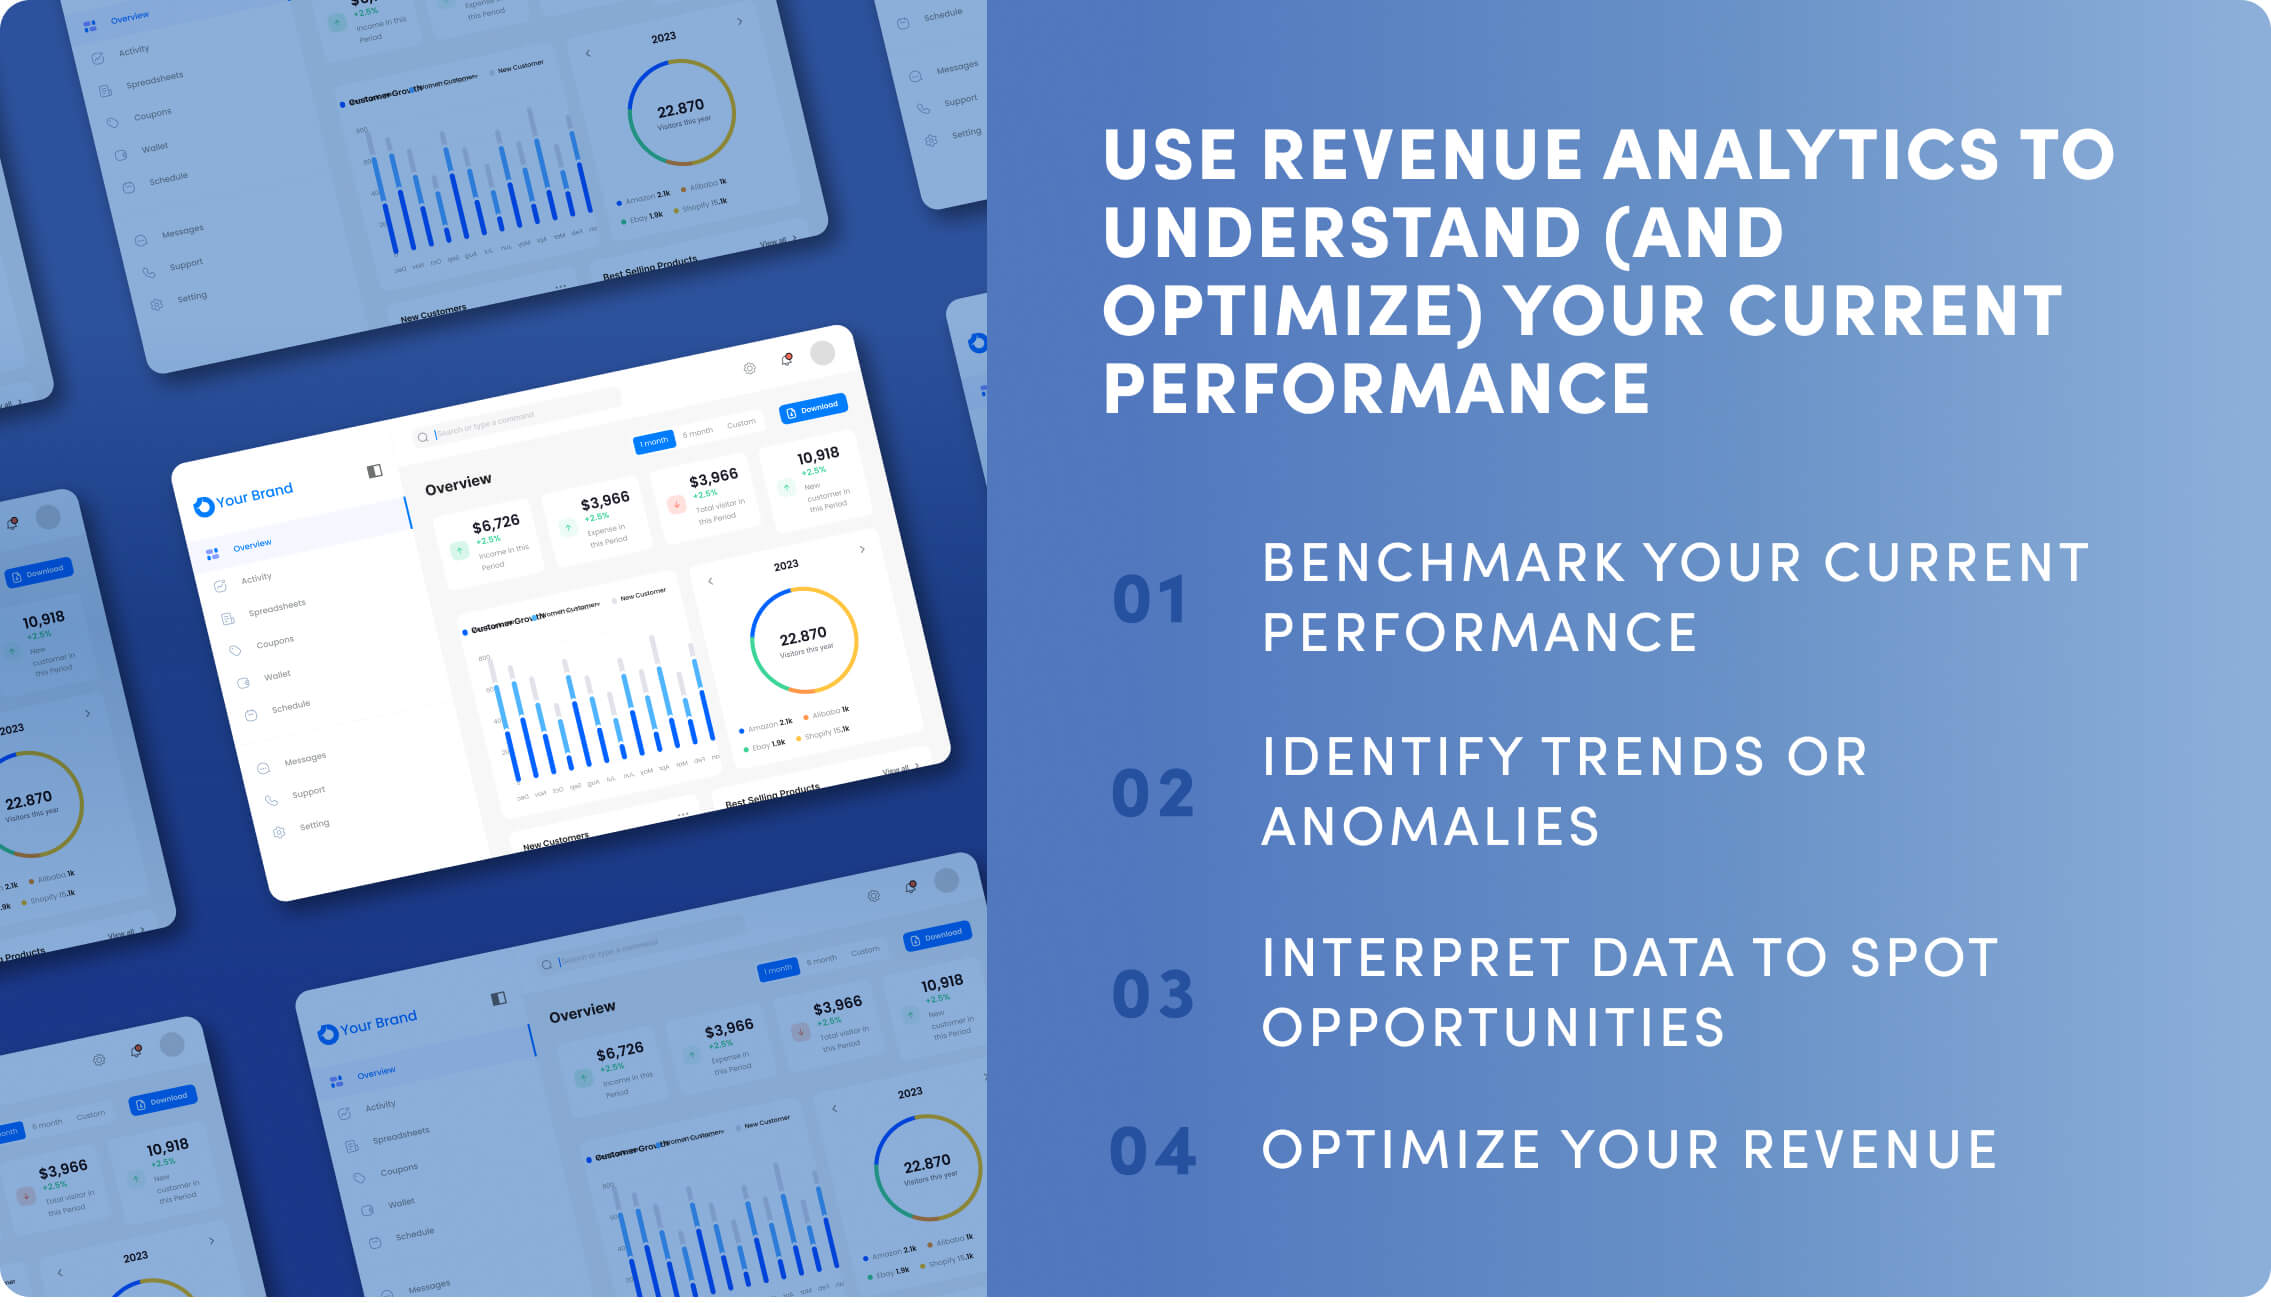
Use analytics to optimize for revenue in four steps: collect your data, identify trends, spot opportunities, and optimize for revenue.
The metrics you focus on should align with your most important KPIs. Make sure you are pulling the data that will help your decision-making so you can reach those KPIs. When collecting data, focus on what you need to build segments and forecast your sales, such as:
Much of this data will come from your Shopify reports, but you should also set up other website analytics tools such as Google Analytics. More data means you can analyze it all in a more meaningful way.
This step shows you the clues that will help you optimize your revenue.
Know which reports are important to your revenue goals and check them regularly for real-time understanding. Then, refine your reports further to make sure you are getting the information you need to make meaningful changes. Once you have that information, create cohorts so you can drill into specific time frames. This allows you to compare data before and after a marketing campaign or see what high-value customers do that others don’t.
The native reporting in your ecommerce platforms is typically intuitive, but don’t be afraid to pull information into spreadsheets or an analytics tool for modeling. It’s often helpful to compare different metrics in a way your Shopify reports don’t do easily.
Be sure to test your information against other sources to make sure the data is accurate. Unique visitors and sales typically move in tandem, so you should see bumps in both after big marketing campaign launches.
Once you have the data flowing and you understand the reports, you should start making predictions. Put the clues together to see the big picture.
Create insights based on the information you get, such as which of your personas has the lowest AOV. They might be good for upsells or discounts. Use your reports to identify high-performing channels, such as specific LinkedIn campaigns or product webinars.
Compare the data you generated to the industry norms. Is one metric significantly higher or lower than your competitors? If so, start looking at related metrics to determine why you're seeing an outlier. Once you have some ideas on what your revenue analytics are telling you, begin making hypotheses you can test.
You have the data. You've analyzed the results and understood what they're telling you. Now it’s time to use the information you’ve collected to make informed decisions about your ecommerce and pricing strategy.
You shouldn't try to make every change at once. Start slow and focus on the most important changes first. You don't want to disrupt your business by completely overhauling everything and potentially upsetting your customers.
Look at which changes will bring the most revenue. What's the biggest outlier compared to your industry? If it's something good, focus more of your efforts on replicating that success with other areas of your business. If it's bad, brainstorm some ideas and do some research to fix the problem. Once that's stabilized, move on to the next outlier and repeat the process.
Here are examples of what you could do based on your data analytics and your business goals:
You have your data. You've made great changes, and your business is thriving. What now?
It's time to make even better use of all that data analysis. Rebuy helps you optimize your revenue by creating a personalized shopping experience for your customers. From Smart Links™ with targeted promotions to dynamic bundles that maximize your inventory, you can use Rebuy to enhance your customer's experience and improve your revenue strategy.
As you get your revenue analytics machine humming, demo Rebuy for more ways to optimize your ecommerce store.
•••
Try Rebuy free and see why the world’s top brands use Rebuy to accelerate sales growth.
Interested in partnering with Rebuy? Let's do it.
To keep up with the latest trends, platform updates, and more, follow us on LinkedIn.
Want new ways to boost customer loyalty and retention? Optimize the post-purchase experience with personalization, data-driven discounts, and more.
Effective inventory management can help you prevent stockouts, avoid overstock problems, keep customers happy, and optimize profitability.
Discover a new era of Rebuy performance—31% faster and 10X lighter.
