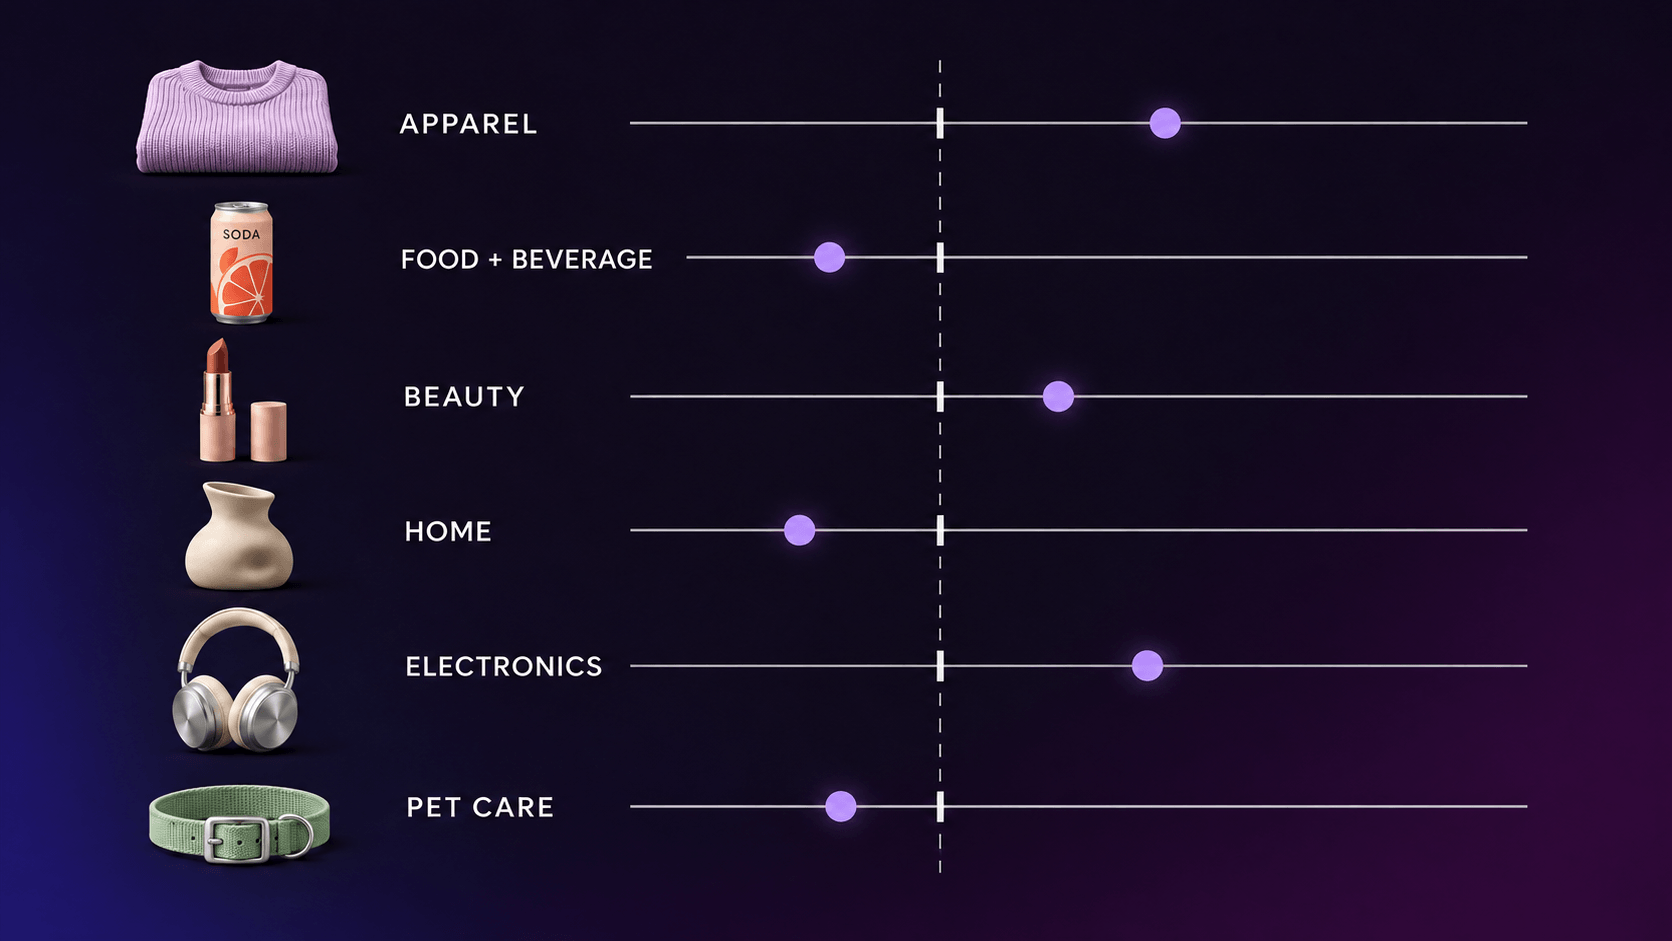
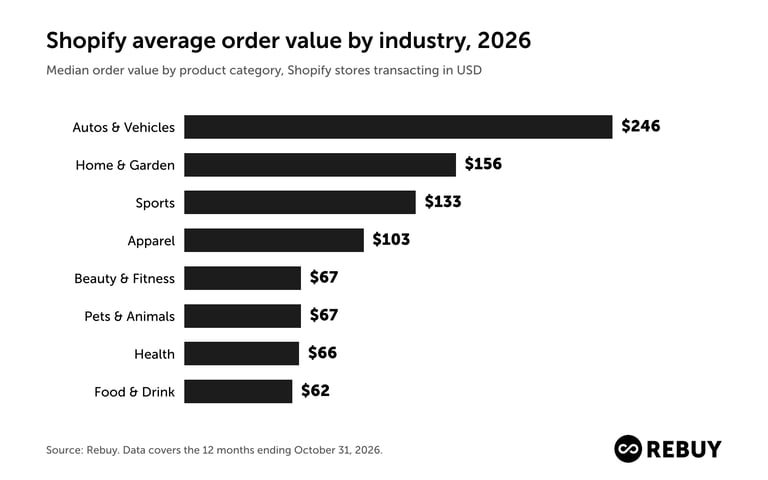
According to Rebuy's 2026 benchmark, the median Shopify store selling food and drink earns $62 per order, and the median home and garden store earns $156. Apparel lands at $103, beauty at $67, and health at $66.
Those figures come from thousands of Shopify stores transacting in USD, measured over the 12 months ending October 31, 2026. We report the median, which is the average order value of the typical store in each category.
Shopify average order value by industry, 2026
| Category |
Median AOV |
Typical range |
| Autos & Vehicles |
$246 |
$134 to $424 |
| Home & Garden |
$156 |
$84 to $343 |
| Sports |
$133 |
$79 to $227 |
| Apparel |
$103 |
$71 to $162 |
| Beauty & Fitness |
$67 |
$46 to $102 |
| Pets & Animals |
$67 |
$43 to $92 |
| Health |
$66 |
$50 to $92 |
| Food & Drink |
$62 |
$47 to $95 |
Source: Rebuy. Data covers the 12 months ending October 31, 2026. Last updated November 18, 2026.
How to read these numbers
- Median: The store in the middle. Half of the stores in a category have a higher AOV and half have a lower one. It's the number to compare yourself with.
- Average: Every store's AOV added up and divided by the number of stores. A few very large stores can pull it well above what most stores see, so we don't use it here.
- Typical range: Where the middle half of stores land. A quarter of stores sit below it and a quarter sit above it.
So if you sell hot sauce and you've been measuring your $58 orders against a sofa brand's $400 ones, you can stop.
You're fine. (The sofa people have their own problems. Shipping, mostly.)
How to read your number
Find your category. Then see where your own average order value (AOV) sits against the typical range for your category.
- Below the range: Your orders are small for your category. This is the clearest sign there's room to grow, and our guide on how to increase average order value is the place to start.
- Inside the range: You're normal. Half of all stores in your category live here.
- Above the range: You're ahead of three quarters of your category on order size. Your next dollar is more likely to come from conversion or repeat purchases.
One caution. AOV is a single number, and a store can raise it while conversion drops. Read the two together.
Why the range tells you more than the median
Some categories are tidy. In health, the typical range runs from $50 to $92 per order. If you sell supplements, your peers look a lot like you.
Home and garden is the opposite. The typical range runs from $84 to $343, a fourfold spread. A candle shop and a patio furniture store share a category and very little else.
In a wide category, compare yourself with stores at a similar price point before you compare yourself with the median.
Average order value by category
Autos & Vehicles: $246
The highest median in the report, with a typical range of $134 to $424. Parts and accessories cost more than hot sauce.
Home & Garden: $156
By far the widest range in the report: $84 to $343. The top quarter of stores earn more than double the median.
Sports: $133
The typical range is $79 to $227. The last 30 days came in at $131, so this one holds steady.
Apparel: $103
The typical range is $71 to $162 per order.
Apparel moves with the season. Over the 30 days ending October 31, the median was $109, about 6% above the full-year figure.
Beauty & Fitness: $67
The typical range is $46 to $102. The full-year and 30-day medians sit within about 2% of each other, so this is one of the steadier numbers in the report.
Pets & Animals: $67
The typical range is $43 to $92. The 30-day median was $71, about 7% above the full-year figure.
Health: $66
The tightest range in the report: $50 to $92. The full-year and 30-day medians sit within 1% of each other.
Food & Drink: $62
The lowest median in the report, with a typical range of $47 to $95. The 30-day median was $66, about 5% higher than the full year, so expect some movement heading into the holidays.
How the holidays change order value
Order value moves with the calendar. Here's what happened last season, from October 2025 through January 2026. Each percentage is the change from October for the typical store.
| Category |
October 2025 median |
November |
December |
January |
| Autos & Vehicles |
$227 |
+4% |
-4% |
0% |
| Home & Garden |
$149 |
+1% |
-5% |
-4% |
| Sports |
$133 |
+1% |
-4% |
-1% |
| Apparel |
$102 |
-1% |
-6% |
-4% |
| Beauty & Fitness |
$64 |
+6% |
-1% |
-1% |
| Pets & Animals |
$68 |
+1% |
-2% |
-1% |
| Health |
$66 |
+4% |
-1% |
0% |
| Food & Drink |
$65 |
+3% |
-2% |
-2% |
- November lifts order value in beauty (+6%), health (+4%), autos (+4%), and food and drink (+3%). This insight feels rather obvious, doesn't it? Shoppers stock up and buy gifts during BFCM.
- December drops below October in every category. Apparel (-6%) and home and garden (-5%) fall the most.
- January stays low in apparel and home and garden (-4% each). Health and autos are back to October levels.
If December order values dip in your category, bundles and volume discounts are two ways to hold them.
Rebuy Dynamic Bundles groups products shoppers buy together, and Buy More Save More in the Rebuy Smart Cart applies a discount as shoppers add more.
This season: October 2026 to January 2027
We're tracking the same months again this year. We'll fill in this table as each month closes, so check back in early December for November.
| Category |
October 2026 median |
November |
December |
January |
| Autos & Vehicles |
$246 |
Coming in December |
Coming in January |
Coming in February |
| Home & Garden |
$152 |
Coming in December |
Coming in January |
Coming in February |
| Sports |
$131 |
Coming in December |
Coming in January |
Coming in February |
| Apparel |
$109 |
Coming in December |
Coming in January |
Coming in February |
| Beauty & Fitness |
$65 |
Coming in December |
Coming in January |
Coming in February |
| Pets & Animals |
$71 |
Coming in December |
Coming in January |
Coming in February |
| Health |
$67 |
Coming in December |
Coming in January |
Coming in February |
| Food & Drink |
$66 |
Coming in December |
Coming in January |
Coming in February |
Which categories run on subscriptions
The rule is quite simple. If the product runs out, a subscription fits.
Vitamins, kibble, coffee, and face wash run out. Jackets, couches, and brake pads don't (ideally).
| Category |
Subscription fit |
| Health |
Core |
| Pets & Animals |
Core |
| Food & Drink |
Core |
| Beauty & Fitness |
Core |
| Home & Garden |
Occasional |
| Apparel |
Rare |
| Sports |
Rare |
| Autos & Vehicles |
Rare |
If you sell in a "rare" category, skipping subscriptions isn't a gap in your strategy. Your product just doesn't run out.
Which tactic fits which category
We looked at where stores in each category earn their additional sales. The pattern follows the product.
| Category |
Where the additional sales come from |
A sensible first move |
| Apparel |
Product recommendations, then the cart and post-purchase offers |
Recommendations on product pages |
| Beauty & Fitness |
Subscriptions, the cart, and recommendations in a near-even split |
Cart upsells with a subscription offer |
| Food & Drink |
Subscriptions, then the cart |
Subscription offers and bundles |
| Health |
Subscriptions, by a wide margin |
Subscription offers |
| Home & Garden |
Recommendations, bundles, and volume discounts |
Bundles and buy more, save more |
| Sports |
Recommendations, the cart, and bundles |
Recommendations and add-ons |
| Pets & Animals |
Subscriptions, by a wide margin |
Subscription offers |
| Autos & Vehicles |
Recommendations, the cart, and bundles |
Bundles |
Three things stand out.
- Consumables run on subscriptions. In health, pets, food, and beauty, the repeat order does the heavy lifting.
- Apparel runs on recommendations. Post-purchase offers also carry more weight in apparel than in any other category we measured.
- Bigger-ticket categories lean on bundles. Home and garden, sports, and autos all show bundles near the top. Our Shopify bundles guide covers the bundle types and when to use each.
The lesson is to copy stores that sell what you sell. A tactic that works for a supplement brand can fall flat for a denim brand, and the reverse is true as well.
Methodology
- Period: The 12 months ending October 31, 2026.
- Cross-check: Each figure is compared with the 30 days ending October 31, 2026.
- Panel: Thousands of Shopify stores transacting in USD. That describes the store's currency, so some of these stores are outside the United States.
- Categories: Eight product categories. We left out categories with too few stores to produce a reliable median.
- Who's in the panel: Stores with Rebuy installed and active in the 30 days before October 31, 2026. This is a large sample of Shopify stores, but it isn't all of Shopify.
- How AOV is calculated: Total sales divided by total orders for each store. Sales exclude tax, shipping, and discounts.
- Why medians: A handful of very large stores can drag an average far from what a typical store sees. The median is the store in the middle.
- Precision: Medians are estimated from percentiles. Most are accurate to within about $2. Home and garden is accurate to within about $7 and autos and vehicles to within about $12, because few stores sit close to their midpoints. Sports, pets and animals, and autos and vehicles are the smallest categories, so their figures are less precise than the rest.
- Holiday table: The same stores measured at the end of October, November, December, and January, using the last 30 days of each month. Each percentage is the typical store's change from its own October.
- Exclusions: Internal stores, development and staging stores, and stores with no assigned category.
- Subscription and tactic findings: Based on sales attributed to Rebuy features in each category over 30 days in October and November 2026. They describe sales that run through Rebuy, so they likely undercount subscriptions sold other ways.
Full year versus the last 30 days
| Category |
12-month median |
30-day median |
Difference |
| Autos & Vehicles |
$246 |
$246 |
0% |
| Home & Garden |
$156 |
$152 |
-3% |
| Sports |
$133 |
$131 |
-1% |
| Apparel |
$103 |
$109 |
+6% |
| Beauty & Fitness |
$67 |
$65 |
-2% |
| Pets & Animals |
$67 |
$71 |
+7% |
| Health |
$66 |
$67 |
+1% |
| Food & Drink |
$62 |
$66 |
+5% |
Apparel, food and drink, and pets differ by more than 3% between the two windows. Use the 12-month figure as the benchmark and expect those three to shift with the season.
What this report doesn't say
These figures describe what stores earn per order. They don't measure the effect of any app on order value.
To cite this report: Rebuy, "Shopify average order value by industry: 2026 benchmarks," data for the 12 months ending October 31, 2026.
FAQs about Shopify average order value
What is a good average order value for a Shopify store?
It depends on what you sell. In Rebuy's 2026 benchmark of thousands of Shopify stores transacting in USD, the median was $62 for food and drink, $66 for health, $67 for beauty and fitness, $103 for apparel, and $156 for home and garden. A good AOV is one inside or above the typical range for your category.
What is the average order value by industry?
Rebuy's 2026 medians by category are: food and drink $62, health $66, beauty and fitness $67, pets and animals $67, apparel $103, sports $133, home and garden $156, and autos and vehicles $246.
What is the average order value on Shopify?
There's no single useful number, because order value depends on the product. Across the eight categories in Rebuy's 2026 benchmark, the median Shopify store earns between $62 and $246 per order.
How do you calculate average order value?
Divide total sales by the number of orders over the same period. A store with $50,000 in sales from 500 orders has an AOV of $100. This report excludes tax, shipping, and discounts from sales.
Why does this report use the median instead of the average?
A few very large stores can pull an average well above what a typical store earns. The median is the store in the middle of the list, so it's a fairer comparison for most merchants.
How can I increase my Shopify average order value?
Match the tactic to your category. Stores selling consumables like supplements, pet food, and coffee earn the most from subscription offers. Apparel stores earn the most from product recommendations. Home and garden stores lean on bundles and volume discounts. Tools like the Rebuy Smart Cart and Rebuy Dynamic Bundles put those offers in front of shoppers.
The short version
Compare your store with stores that sell what you sell. Find your range, find the tactic that fits your product, and ignore the numbers from categories that aren't yours.
If you'd like to see what that looks like on your own store, we'd love to show you around. Book a Rebuy demo →